

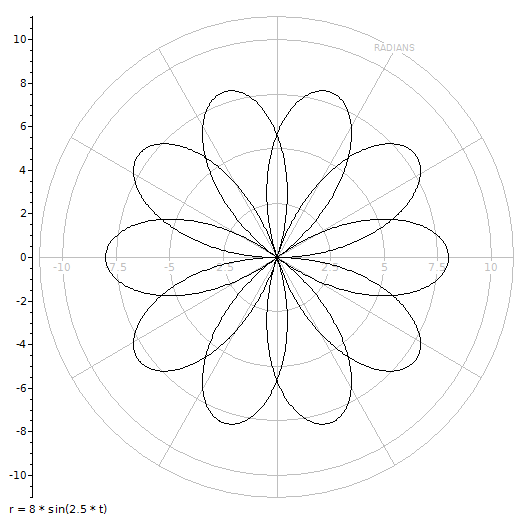
A polar plot shows a function or data expressed in polar coordinates, where each point is defined by the radial coordinate "r" and the angular coordinate "t". This is is useful in situations where the relationship between two points is most easily expressed in terms of angles and distance.
Any X-Y style chart, including function and data plots, can be converted to polar form simply by selecting Polar Plot from the Axes menu.
This will cause the X-Y data to be plotted as if it were of the form:
r = f(t)
Where "r" is radius, and "t" is the angle specified in the units of graphing window's angle mode. Polar grid lines will also be drawn instead of the usual cartesian grid. See right.
When graphing a function, you may optionally use "x" or "t" as the inpendent variable, and select the Polar Plot menu option. However, there are subtle differences between the two inputs, as follows:
If you explicitly use angle "t", instead of "x", polar coordinates will be used automatically. Polar grid lines, however, will only be drawn when the Polar Plot option is selected from the menu.
You can use the Copy f(x) button to copy data generated by the function grapher. If you explicitly used "t", rather than "x", in the input expression, the resulting X-Y data will be populated with values transformed according to the following trigonometric relations:
x = r cos(t)
y = r sin(t)
Note that the use of both the "x" and "t" variables in the same input string is disallowed.
See also: Graphing & List Window, and Graphing Examples.