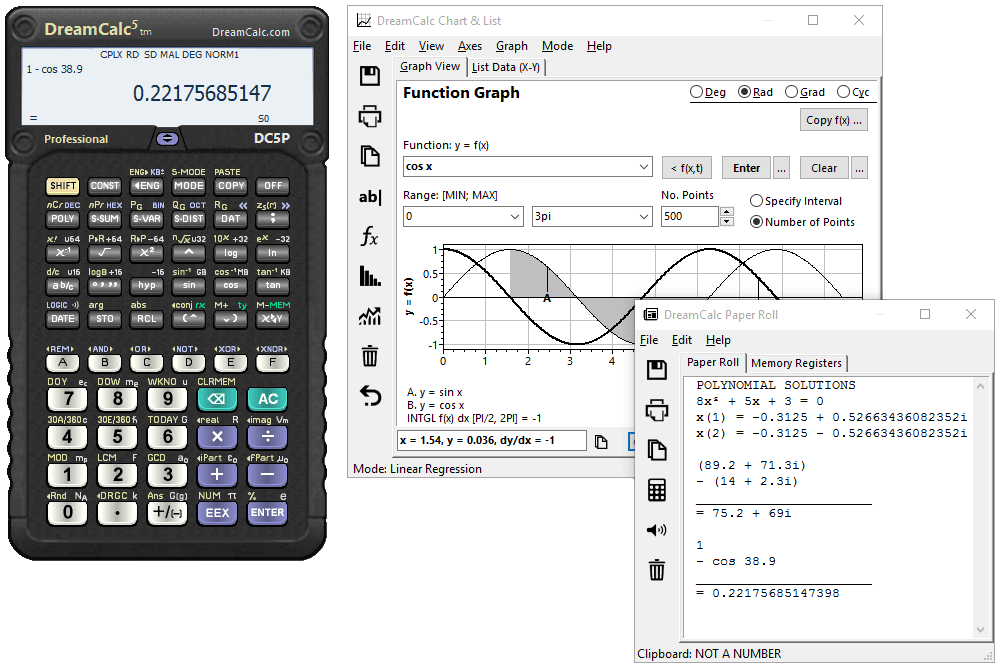
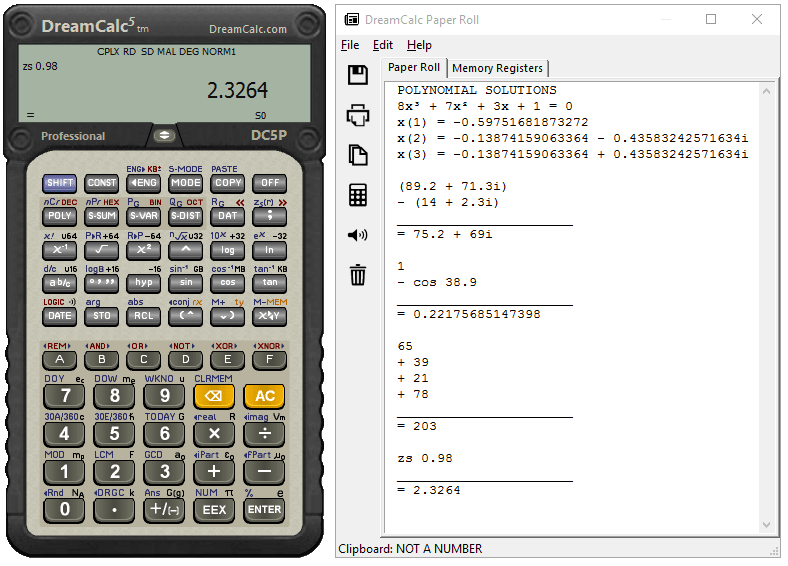
The plots below were generated in seconds by DreamCalc.
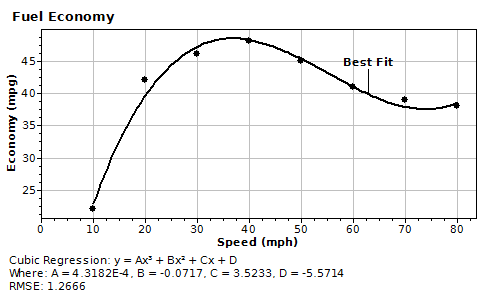
A scatter plot of X-Y data with a line of best fit, as determined by cubic regression analysis.
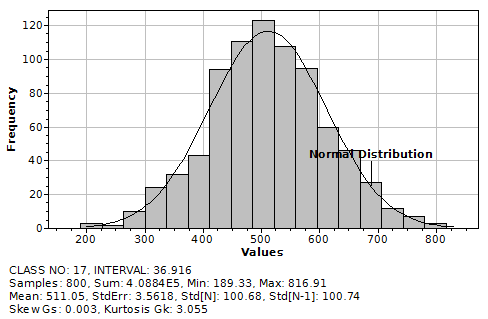
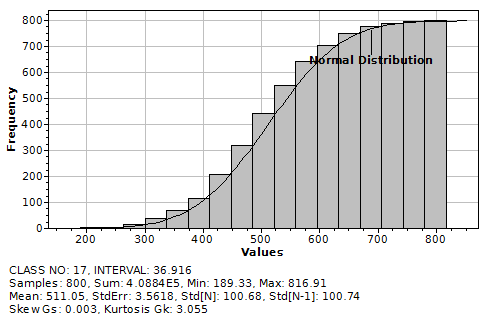
A histogram of statistical data. The second chart shows a cumulative plot of the same data.