

This introductory page provides a convenient overview to some of the features of the DreamCalc Scientific, Graphing and Financial calculator. Much more detailed information is also available throughout the remainder of this user guide.
See also: Introductory Examples
DreamCalc supports three styles of input: prefix "modern" algebraic (MAL), postfix "classic" algebraic (CAL) and Reverse Polish Notation (RPN). In most examples in this User Guide, prefix algebraic is assumed as it is the most widely used. For more information about input modes, refer to Calculator Input Style.
You can click the keys with the mouse or use your keyboard. The [SHIFT] key grants you access to the functions printed above the keys, just as you would naturally expect. It is possible to use a combination of keyboard and mouse, i.e. holding the keyboard SHIFT while clicking keys with the mouse.
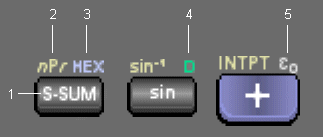
Function Key Labels
Each key typically supports several functions or input mnemonics. See below right.
The colors vary depending upon the chosen skin, however, the color scheme remains consistent — each is colored uniquely.
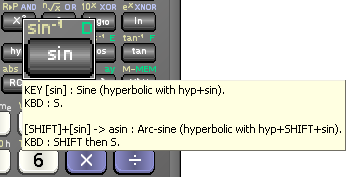
Right-Click on Keys for Help
Functions, such as "sin", are accessed by single keyboard short-cuts, rather than free text. For example, to input the sine function, you would simply press "S" rather than typing out "sin".
Right clicking on a key shows pop-up information, including its keyboard input strokes, as seen right.
See the Keyboard Input section for further information.
Press the calculator's [MODE] key to show the on-screen mode menu, as shown below.
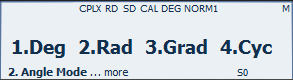
On-Screen Mode Menus
Press [MODE] repeatedly to page through the menu options, until you reach the desired page.
Alternatively, you can quickly change mathematical modes using the Modes main menu.
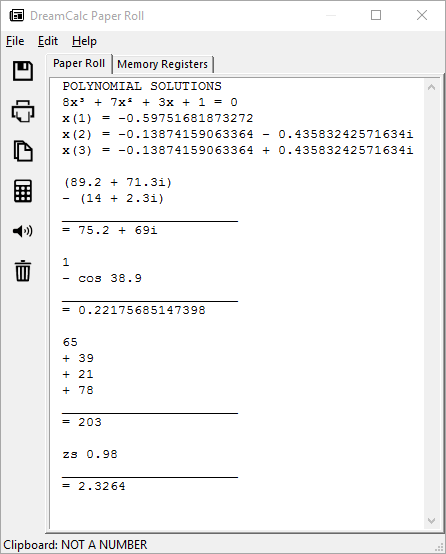
Paper Roll Window
Press F11 to show (toggle) the Paper Roll & Register Window, or select it from the Window menu. See right.
This window shows a historical log of calculations and allows you to view and edit any value held in a memory register. See the Paper Roll & Register Window section for further information.
Values can be stored and recalled from the calculator keypad using [STO] and [RCL] with keys marked "MEM", "A"-"F" and "0"-"9".
You can also view and edit values held in memory directly from the Paper Roll & Register Window.
Example 1: Store and Recall
345 [STO] [A] (store to 'A' register)

[AC] (all clear)

212 [+] [RCL] [A] (recall from 'A' register)
[ENTER]
Displays: 557  (result of 212 + 345)
Example 2: The MEM Register
10 [STO] [MEM] (store to 'MEM' register)
5 [SHIFT] [M+] (add to 'MEM')
3 [SHIFT] [M-] (subract from 'MEM')

[AC] (all clear)

[RCL] [MEM] (recall sum)
Displays: 12
Additionally, the registers "rx" and "ty" are used with the P►R and R►P functions to access result values. The Professional Edition also provides the following financial registers: "n", "i%", "PV", "PMT", "FV" and "K", where the "K" register is used with bond price calculations.
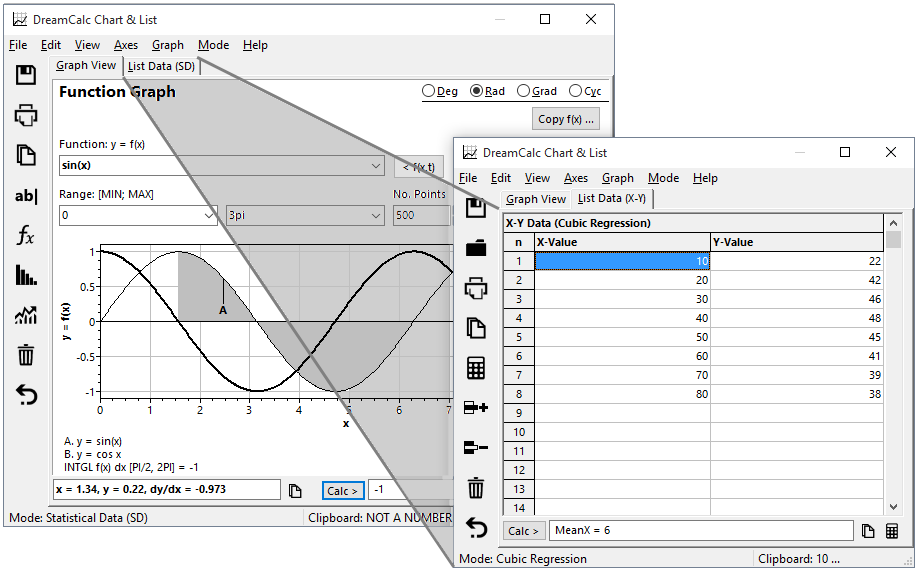
Graphing & List Window
Press F12 at any time to show the Graphing & List Window, or select Graphing & List from the Window main menu.
The Graphing and Professional editions of DreamCalc allow you to graph functions, plot data and edit lists. DreamCalc can graph two functions simultaneously and show a range of charts, including histograms, bar charts, polar plots and regression fits. You can also use this window to perform numerical calculus.
To graph a function, simply select Function Graph from the window's Graph menu and type in your function using "x" as the variable. Specify the x-value range and click Enter (or select Plot A or Plot B from the Enter drop-down button).
See the Graphing & List Window and Graphing Example pages for more information.